LSST will allow us to understand how and when the Milky Way's bulge formed
The centre of the Milky Way shows a prominent bulge which extends above the disc. Up till now studies have shown that the bulge is the vertically extended part of the bar which formed from the disc. Simulations show that such bulges form via instabilities that form in the bar, thickening its centre to large heights. Such box/peanut-shaped bulges are very common in barred galaxies as massive as the Milky Way. However this interpretation requires that stars of different ages will distribute differently on the bulge, with the very oldest ones appearing rounder, while slightly younger ones (but still old) appearing more elongated. Viewed from the Earth this results in the appearance of a central dense old age distribution bracketed by two arms that are slightly younger (Figure 1). LSST will permit us to map the age distribution of stars in the bulge to high fidelity to test this interpretation. Proper motions will allow separation of the disc and bulge and multi-band colour-magnitude diagrams constructed to measure the main sequence turnoff and accurate relative ages.
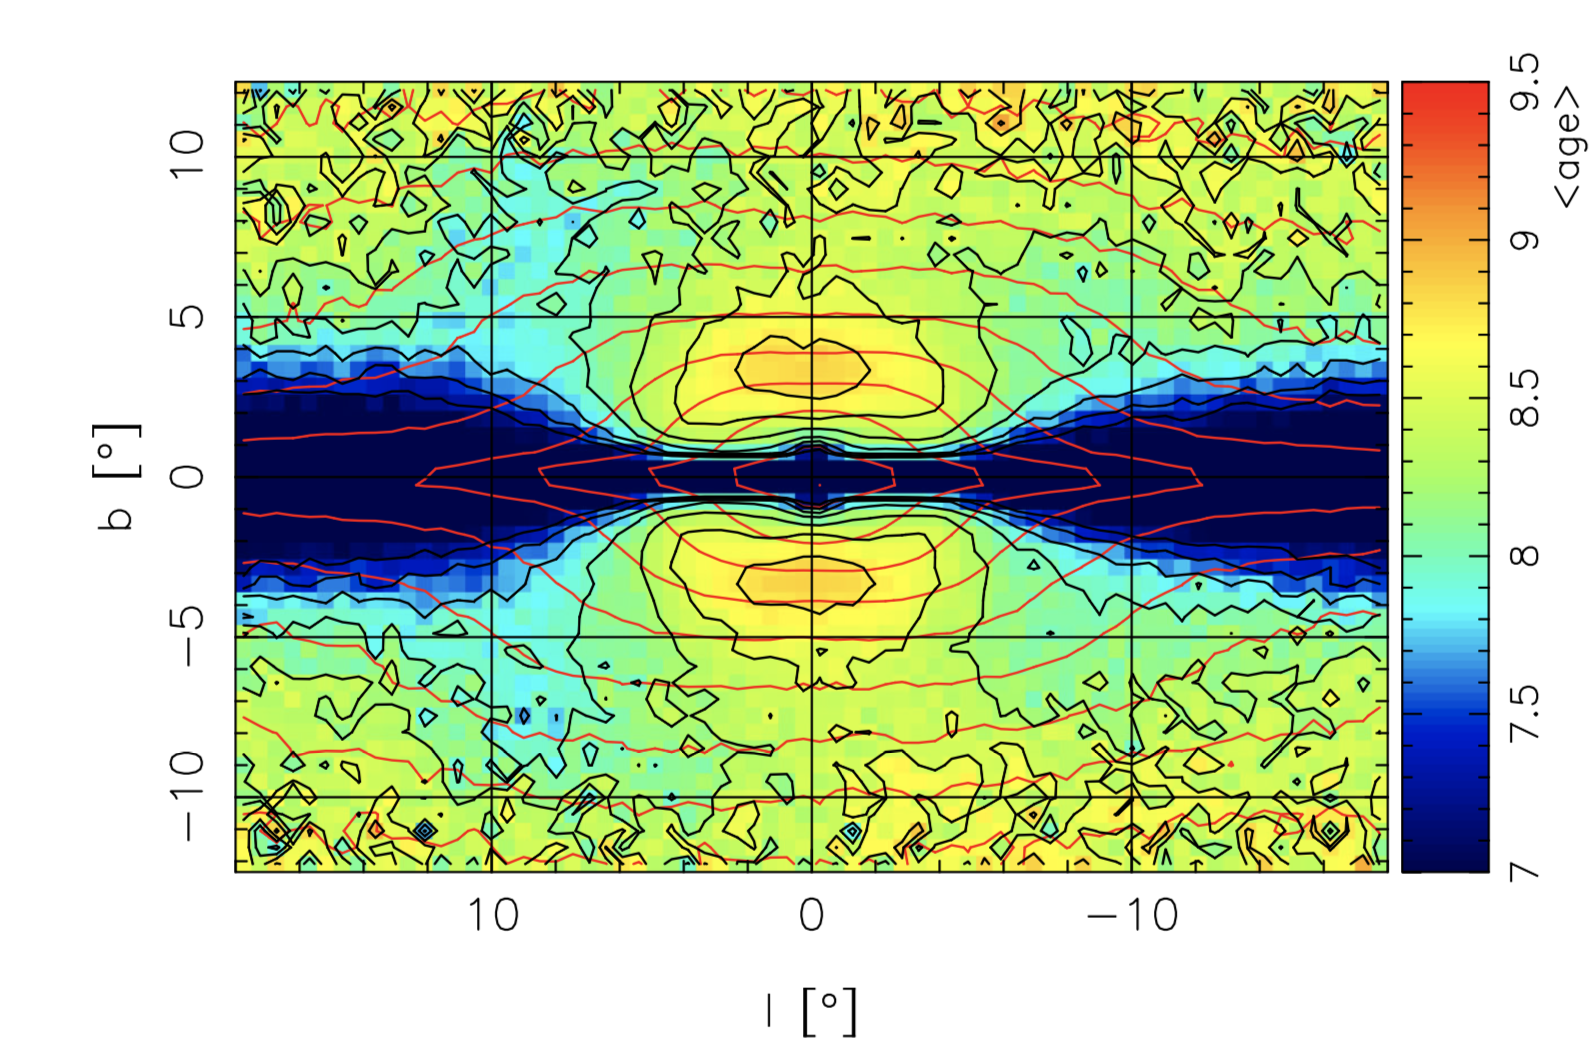 Figure 1 (taken from Debattista et al, 2017, MNRAS, 469, 1587) This plot shows the age distribution of stars in a simulation of the evolution of the stars in the Milky Way. The map is defined on a coordinate grid of (l,b), which are, respectively, Galactic Longitude and Latitude, and only the central portion of the Milky Way is plotted here. Black contours trace the age distribution (with ages indicated by the colour bar to the right of the plot), while red contours show lines of constant stellar density.